From a KitKat break to a 2-minute Maggi, Nestle has built an indomitable range of products that are liked and enjoyed by people of all ages. Nestle is the world’s largest food and beverage company. It houses more than 2000 brands under its stable, ranging from global icons like KitKat, Nescafe, and Nestea to local favorites such as Maggi, Polo, Milkmaid, etc.
In this article, we will understand Nestle and its share price performance. Let’s get started.
Brief Overview of Nestle
Nestle is a Swiss multinational food and beverage corporation whose history dates back to 1866 when the Anglo-Swiss Condensed Milk Company was founded.
In 1867, Henry Nestle, who was not connected with Anglo-Swiss, made a breakthrough in the development of baby food. In 1905. Henry Nestle merged his company with Anglo-Swiss to form Nestle Group. By 1905, the company had more than 20 manufacturing facilities and selling products in Africa, Asia, Australia, and Latin America.
Between all the crises, the company continued launching new products. In 1938, Nestle launched its most iconic coffee brand, Nescafe, and in 1947, it added Maggi soups and seasonings.
The group’s Indian unit started operations on 28th March 1959 in New Delhi. Today, Nestle is one of the largest food & beverage companies in the country, with nine manufacturing facilities across India.
Business Overview of Nestle
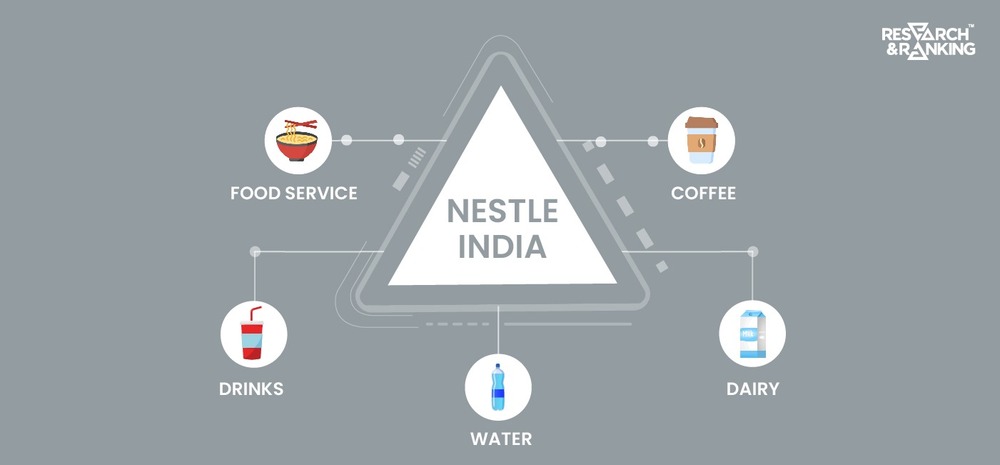
Nestle has divided its food & beverages business into the following four categories:
- Prepared Dishes and Cooking Aids: It includes the products sold under Maggi, such as instant noodles, ready-to-mix soup, and ketchup.
- Milk Products and Nutrition: It includes all the dairy products and health drinks like Milo, Crelac, etc.
- Confectionary: This category includes KitKat, Munch, and Milkybar.
- Beverages: It includes ready-to-consume drinks and Nescafe coffee.
The following is the contribution to revenue of all four categories from January to December 2022.

Nestle has recently made a foray into the pet food business by acquiring Purina Petcare India Pvt. Ltd. Under Accounting Standard 108 on “Operating Segments,” the company reports all its revenue from operations within a single segment, namely “Food.”
Key Management Personnel
- Mr. Suresh Narayan has been the Chairman and Managing Director of Nestle India since 1 August 2015. Before joining Nestle India, he was Chairman and Managing Director of Nestle Philippines. Mr. Narayan joined the Nestle Group in 1999 as Executive Vice President for Sales in India. He is an Economics graduate from Delhi School of Economics and has participated in the leadership programs of the London Business School.
- Ms. Svetlana Boldina is the Executive Director- Finance & Control and CFO. She was appointed CFO on 1st March 2023 for five years. Ms. Boldina is a Russian national with an Engineering degree from Moscow Telecommunication University and an MBA in Accounting and Finance Technology from the Russian Academics of Economics. She has been with Nestle for more than 25 years and served in many geographies.
- Mr. Satish Srinivasan is the Executive Director of Technical and has substantial experience around different markets and zones. He is responsible for technical areas of the company, including all existing and future locations of factories. Mr. Satish joined Nestle in 1993 and has worked worldwide on various assignments.
- Mr. Anurag Patnaik is the Head of Human Resources at Nestle India. He joined the company as a Management Trainee in June 2005. Mr Patnaik has a B.Tech from Biju Patnaik University of Technology, Orissa, and a PM & IR, Human Resource from XLRI Jamshedpur.
Shareholding Pattern

Nestle India Financials
Nestle India has a fiscal year that runs from January to December.
Revenue
In 2022, Nestle’s total revenue from operations grew by 14.6% to 16,897 in 2022 from 14,740 in 2021. For the six months ending on 30th June 2023, the company’s revenue from operations grew by 18% to ₹9,489 crore compared to ₹8,038.3 crores during the same period the previous year.

Profit from Operations
In 2022, the company’s operating profit rose by 4.1% year-on-year to ₹3370 crores from ₹3230 crores in 2021. However, the profit percentage from operations to sales fell to 20% in 2022 from 22% in 2021.
Net Profit
In 2022, Nestle reported a 12.8% growth in net profit to ₹2,390 crores from ₹2,118.4 crores in 2021. For a six-month period that ended on 30th June 2023, the net profit of the company rose by 30% to ₹1,435 crores compared to ₹1,109 crores during the same period the previous year.

Key Financial Ratios
Current Ratio: At the end of 2022, the current ratio of the company increased to 1.1 times from 1 time at the end of 2021.
Inventory Turnover Ratio: The inventory turnover ratio 2022 declined marginally to 9.5 times from 9.7 times at the end of 2021.
Trade Receivables Turnover Ratio: The company’s trade payable turnover ratio improved by 6% to 93.8 times in 2022 from 88.6 times in 2021.
Trade Payables Turnover Ratio: In 2022, the company’s trade payables turnover ratio increased 6.4 times from 6 times at the end of 2021.
Net Profit Ratio: The net profit margin of the company in 2022 was 14.2%, declining marginally from 14.4% in 2021.
Return on Capital Employed (ROCE): The ROCE of the company in 2022 fell by 16% to 122.4% from 145.2% in 2021.
The debt-to-equity ratio and interest service coverage ratio are irrelevant as the company has negligible debt.
Nestle Share Price Analysis
The shares of Nestle were listed long back in India in around the 1980s and have been a consistent performer in the market. Nestle has done five bonus issues since its listing and recently announced a split in the ratio of 1:10. 100 shares issued at listing has now become 3600 shares.
| Announcement | Face Value | Ratio | Number of Shares |
| Pre-bonus and split share | ₹10 | – | 100 |
| Bonus Issue- 18 July 1983 | ₹10 | 3:5 | 160 |
| Bonus Issue- 18 July 1986 | ₹10 | 1:1 | 320 |
| Bonus Issue- 18 July 1989 | ₹10 | 3:5 | 192 |
| Bonus Issue- 30 September 1993 | ₹10 | 1:4 | 240 |
| Bonus Issue- 23 April 1996 | ₹10 | 1:2 | 360 |
| Share Split- 19th October 2023 | ₹1 | 1:10 | 3600 |
The company has a consistent track record of paying dividends to its shareholders. It paid ₹200 in 2021, ₹210 in 2022, and ₹242 in 2023 as dividends.

As of 28 October 2023, Nestle share price has given a CAGR return of 12% and 20% in the last three and five years, respectively. Nestle share price at an all-time high level is ₹23,600, which it made on 16th October 2023. The market cap of Nestle India as of 28th October 2023 is ₹2,31,947 crores.
Peer Comparison
| Company Name | Nestle India | Hind Unilever | Britannia |
| Face Value | ₹10 | ₹1 | ₹1 |
| Share Price (as of 28th October 2023) | ₹24,057 | ₹2482 | ₹4,514 |
| P/E Ratio (as of 28th October 2023) | 80.2 | 56.4 | 51 |
| Market Capitalization | ₹2,31,947 crores | ₹5,83,180 crores | ₹1,08,735 crores |
| Revenue | ₹16,897 crores | ₹58,154 crores | ₹16,301 crores |
| Operating Profit Margin (FY23) | 20% | 21.7% | 16.3% |
| Net Profit Margin (FY23) | 14.2% | 17.1% | 13.5% |
| ROCE (FY23) | 122.4% | 101.9% | 47.33% |
| Distribution Network (FY23) | – | 9 million retail stores | 2.68 million retail stores |
Key Highlights
- Nestle India has consistently recorded double-digit sales growth in the range of 10-14% over the last five years, except in 2020, when growth was impacted by COVID-19. Between 2016 and 2022, sales have grown at a CAGR of 10.7% and sales volume at 8.2%. And net profits have grown at a CAGR of 15.6% during the same period.
- The company is opening up its 10th manufacturing in Orissa with an investment of around ₹900 crores.
- Nestle is strengthening its distribution network and following a RURBAN approach by going deeper into smaller cities and towns. In 2022, it added 55,000 villages, totaling 1,65,376 villages. Rural India contributes ~20% to the total sales volume and value.
- Nestle is rapidly expanding its footprint in e-commerce, with the contribution of e-commerce to domestic sales increasing from 0.6% in 2016 to 6.5% in 2022.
- Since 2015, the company has launched 110 new products, accounting for more than 5% of total sales value. Currently, 30 new products are in the pipeline with millet-based products under the Maggi, Nestle a+, and Caregrow brands.
- The out-of-home professionals’ category is witnessing strong growth due to a revamp in strategy, resetting geography, channel, and sales priority. In 2022, the category recorded 39% year-on-year growth. The total number of Maggi and Nescafe branded kiosks at the end of 2022 reached 620
- The company board has approved a change in the financial year to April to March instead of currently following the January to December period. Hence, the company will be reporting 15 months of financial results for the current fiscal.
Brief Industry Overview
- The FMCG sector is the fourth-largest sector of the Indian economy and has a distinctive Indian advantage.
- The Gross Value Added (GVA) in the food processing sector was ₹2.24 lakh crores in 2019-20, contributing 1.69% of the total GVA in the country.
- According to the data shared by the Ministry of Food Processing Industry, the Indian food processing market is estimated to reach $535 billion by 2025, growing at a CAGR of 15.2%. Tier-2 and Tier-2 cities could mirror the similar consumption trend visible in metropolitan areas by consuming more processed foods in the coming years.
- Because of its enormous impact on the Indian economy, the food processing industry is supported by several government initiatives. For food products, the government has proposed a production-linked incentive scheme. It is expected to allow for an increase in food processing capacity of nearly ₹30,000 crore.
- The government has permitted 100% FDI into the food processing sector under the automatic route, further brightening the prospects of the Indian FMCG market. The Food Processing Sector received $709.72 million in FDI equity inflows from April 2021 to March 2022. From April 2000 to December 2022, the total FDI equity inflow into the sector was $ 11.79 billion.
*Disclaimer Note: The securities quoted, if any, are for illustration only and are not recommendatory. This article is for education purposes only and shall not be considered as recommendation or investment advice by Research & Ranking. We will not be liable for any losses that may occur. Investment in securities market are subject to market risks. Read all the related documents carefully before investing. Registration granted by SEBI, membership of BASL, and certification from NISM in no way guarantee the performance of the intermediary or provide any assurance of returns to investors.
FAQ
When did Nestle India start operations in India?
Nestle is one of the oldest food & beverage companies in the world, whose history dates back to 1806. The group’s Indian unit started operations on 28th March 1959 in New Delhi.
How has Nestle share price performed in the last five years?
As of 17 October 2023, Nestle share price has given a CAGR return of 19% in the last five years. It reached an all-time high level of ₹23,600 on 16th October 2023.
What brands are under Nestle?
Nestle houses iconic brands like Maggi, Nescafe, Cerelac, KitKat, Munch, Milkybar, Milkmaid, etc.