Introduction:
India’s banking system has remained one of the most stable globally, even during times of global uncertainty. It has a healthy structure with low non-performing loans and strong capital and liquidity buffers. Increased infrastructure spending, quick project implementation, and ongoing reforms are set to further boost the sector’s growth for both PSU banks and private banks. This building opportunity is also reflected in the NIFTY PSU Bank index’s yearly gains of 33.35% as of 23rd October 2024.
Source: NSE
The growth in the industry can be leveraged by investing in the stocks of PSU banks like the Bank of Baroda. So, what is the Bank of Baroda share value? And how do investment advisory firms evaluate the BOB share price using fundamental analysis? Let’s understand.
Overview of Bank of Baroda:
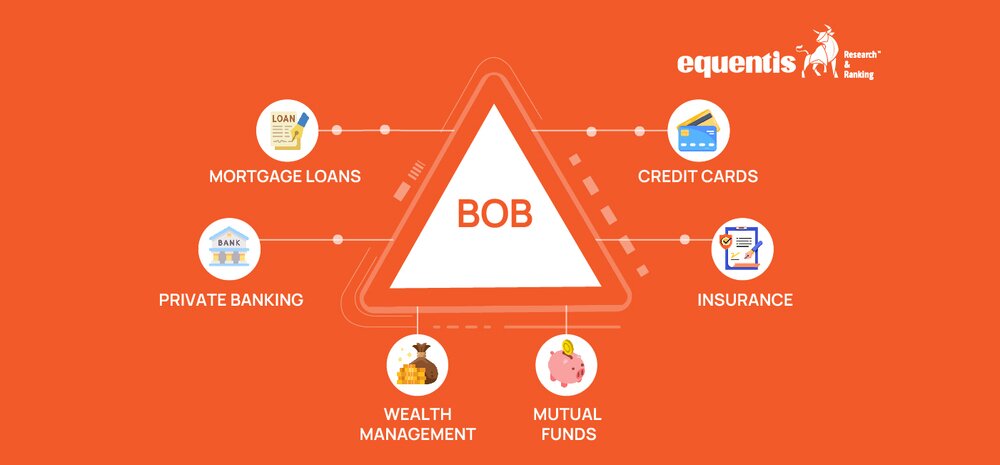
Bank of Baroda, often called BoB, is a nationalized bank headquartered in Vadodara, Gujarat. It was founded in 1908 by Maharaja Sayajirao Gaekwad III, initially serving as a private bank for the princely state of Baroda. In 1969, it was nationalized by the Government of India, which now holds a 63.97% stake. In 2019, the Bank of Baroda merged with Vijaya Bank and Dena Bank, making it India’s third-largest public sector bank. It offers a range of services, including personal, corporate, international, SME, rural, and NRI banking, along with treasury services.
The bank is known for its digital presence through the ‘Bob World’ app, which provides 185+ banking services online. For net banking, the service is called Baroda Connect. BoB has an extensive network with around 8,168 branches in India, 94 branches abroad, and 11,475 ATMs, with 35% of its branches in rural areas. It also operates 150 currency chests across the country.
Share Holding Pattern:
The shareholding pattern of the bank as of the quarter ending September 2024 is as follows-
Key Management Personnel:
The Bank of Baroda was founded on 20th July 1908 by Maharaja Sayajirao Gaekwad III, the Maharaj of Baroda. As of FY2024, the bank operates under the leadership of the following key management personnel:
- Shri Debadatta Chand (MD and CEO):
Shri Debadatta Chand became the Managing Director and CEO of the Bank on 1st July 2023. With over 29 years of experience in banking and finance, he holds a B.Tech, an MBA, CAIIB, a Post Graduate Diploma in Equity Research, and a Ph.D. in Management.
Shri Chand started his career at Allahabad Bank in 1994 and worked at SIDBI before joining PNB in 2005. He became Executive Director at Bank of Baroda, overseeing corporate credit, institutional banking, treasury, and foreign exchange, before becoming MD & CEO in July 2023.
- Chayani Manoj Sundar (CFO):
Chayani Manoj Sundar became the Chief Financial Officer (CFO) of Bank of Baroda on June 21, 2024. With over 19 years of experience in banking, he specializes in financial and credit operations. Sundar is a chartered accountant at ICWA with a bachelor’s degree in commerce. He succeeded Ian Gerard Desouza in this role.
- Mr. Ravindra Singh Negi (Chief Risk Officer):
Mr. Negi is a seasoned banker with over 25 years of experience at the Bank of Baroda. He has expertise in risk management, treasury, corporate and retail credit, international banking, and general branch operations. Since 1st May 2024, he has served as the Group Chief Risk Officer (GCRO).
Before this, he oversaw global operations as the Deputy Chief Risk Officer for over two years. He also led the Bank’s GCC operations as CRO in Dubai and headed the Global Mid Office (Treasury) during his 11.5-year journey in risk management.
Bank of Baroda Financials:
- Net Interest Income:
Net Interest Income (NII) is the difference between the interest a bank earns from its lending activities (like loans, mortgages, and other credit products) and the interest it pays to depositors on savings accounts, fixed deposits, or other forms of borrowing. It’s the profit a bank makes from its core business of lending money after covering the cost of funds it provides to customers. As of FY2024, the bank’s NII was Rs.44,721.53 crore.
- Net Profit:
Bank of Baroda’s net profit has been growing consistently after the loss incurred in 2017-18, and it increased significantly in 2021-22. As of FY2024, the bank’s net profit was Rs.17,788.78 crore.
- Deposits:
Deposits represent the funds that customers place in the bank, such as savings accounts, fixed deposits, and current accounts. These are liabilities for the bank because the bank owes this money to its customers. As of FY2024, the total deposits for the bank reached Rs.13,26,958 crore, and the CASA deposits of Rs.5,14,366 crore.
| Financial Year | Total Deposits (Rs. Cr.) | CASA Deposits (Rs. Cr.) |
| 2017-18 | 5,91,314.8 | 1,92,323.1 |
| 2018-19 | 6,38,689.7 | 2,08,403.8 |
| 2019-20 | 9,45,985.4 | 3,15,952.4 |
| 2020-21 | 9,66,996.9 | 3,68,027.6 |
| 2021-22 | 10,45,938.56 | 4,10,122.92 |
| 2022-23 | 12,03,687.79 | 4,75,096.83 |
| 2023-24 | 13,26,958 | 5,14,366 |
Source: Annual Report
- Advances:
Advances refer to the loans or credit the bank provides to individuals or businesses, including home loans, personal loans, and business loans. They are assets for the bank since it earns interest income from borrowers. As of FY2024, the bank’s net advances were Rs.1065781.72 crore.
| Financial Year | Advances (Rs. Crore) |
| 2017-18 | 4,27,431.8 |
| 2018-19 | 4,68,818.7 |
| 2019-20 | 6,90,120.7 |
| 2020-21 | 7,06,300.51 |
| 2021-22 | 777155.18 |
| 2022-23 | 940998.27 |
| 2023-24 | 1065781.72 |
Source: Annual Report
Key Financial Ratios for Bank of Baroda:
As of the financial year ending March 2024, the key financial ratios are as follows-
- Net Interest Margin (NIM): The bank’s NIM is 3.18%, meaning that for every Rs.100 of interest-earning assets, the bank earns Rs.3.18 in net interest income. A higher NIM generally indicates better profitability from the bank’s lending activities.
- Earnings Per Share (EPS): The bank’s EPS is Rs.34.40, which means that the bank earned Rs.34.40 in profit for each share. A higher EPS generally indicates better profitability per share for investors.
- Return on Average Assets (ROAA): The bank’s ROAA is 1.17%, meaning it earned Rs.1.17 for every Rs.100 of its average assets. The ratio indicates how efficiently the bank uses its assets to generate profit.
- Return on Equity (ROE): The bank’s ROE is 18.95%, indicating that for every Rs.100 of shareholders’ equity, the bank earned Rs.18.95 in profit. This suggests a strong return on the money invested by shareholders.
- Capital Adequacy Ratio (CAR): The bank’s CAR is 16.31%, which means it has Rs.16.31 in capital for every Rs.100 of risk-weighted assets. A higher CAR indicates a strong capital base to absorb potential losses.
- Cost-Income Ratio: The bank’s cost-income ratio is 47.71%, meaning it spends Rs.47.71 for every Rs.100 it earns in income. A lower ratio is generally favorable, as it shows better operational efficiency.
- Net Non-Performing Assets (Net NPA): The bank’s Net NPA is 0.68%, which means that for every Rs.100 of loans, only Rs.0.68 is classified as non-performing or bad loans. A lower NPA reflects better asset quality and lower credit risk.
Source: Annual Report
Bank of Baroda Share Price Analysis:
The BOB share price can be analyzed using both techniques of analysis. Thus, there is no question of fundamental analysis vs technical analysis to determine the right outcome. Bank of Baroda was listed on the NSE in February 1997. As of 23rd October 2024, the bank’s market cap is Rs.1,23,155.99 crore, and its share price is Rs.238.66, more than the Bank of India share price of Rs.98.78. Since its inception, the stock has given a return of over 1700%.
As of 23rd October 2024, the stock has returned 21.87% over the past twelve months, lower than the index growth of 33.35% for the same year. Moreover, the stock’s growth is also lower than the one-year returns of NIFTY (26.55%) and SENSEX (23.81%) as of the same date.
Source: Money Control
Other Performance Highlights of Bank of Baroda:
- The bank’s domestic CASA grew 5.4% year-on-year, reaching Rs.4,66,401 crore in FY 2024.
- Global gross advances increased to Rs.10,90,506 crore in FY 2024, compared to Rs.9,69,548 crore in FY 2023. This represents a 12.5% year-on-year growth.
- The bank’s net worth for FY 2024 rose to Rs.93,850.76 crore. This includes paid-up equity capital of Rs.1,035.53 crore and reserves of Rs.1,11,188.05 crore.
- The UPI remittance success rate for the bank stands at 92% for FY2024.
- In March 2024, the bank implemented a Green Finance Framework to raise Green Deposits and support credit flow for green activities.
- An MOU was signed with KFW, a multilateral finance agency, under the “Solar Partnership—Promotion of Solar/PV in India” program. This program aims to refinance investments in solar energy at competitive interest rates.
- The bank also entered into an MOU with IREDA. This collaboration focuses on co-lending and co-origination for renewable energy projects, along with loan syndication and underwriting.
Source: Annual Report
Bottomline
Bank of Baroda’s shares currently have a PE ratio of 6.80, a generally accepted PE level in the market. The bank’s financial performance in FY2024 shows promising growth, driven by increased CASA, advances, and successful initiatives in green finance and renewable energy partnerships.
However, deciding whether to invest in the Bank of Baroda or another bank should depend on your analysis using a stock screener, financial profile, and investment objectives. If necessary, seek the help of a registered stock advisor and align your decisions with your long-term goals before investing.
FAQs
What is the overview of the Bank of Baroda?
Bank of Baroda (BOB) is a government-owned public sector bank based in Vadodara, Gujarat. It is India’s third largest public sector bank, following the State Bank of India. As of 2023, it is the 586th largest company on the Forbes Global 2000 list.
What are the pillars of the Bank of Baroda?
The bank stands on the pillars of reliability, transparency, and integrity.
What is the Bank of Baroda famous for?
Bank of Baroda is famous for its domestic presence and digital initiatives.
Disclaimer Note: The securities quoted, if any, are for illustration only and are not recommendatory. This article is for education purposes only and shall not be considered as a recommendation or investment advice by Equentis – Research & Ranking. We will not be liable for any losses that may occur. Investments in the securities market are subject to market risks. Read all the related documents carefully before investing. Registration granted by SEBI, membership of BASL & certification from NISM in no way guarantee the performance of the intermediary or provide any assurance of returns to investors.
How useful was this post?
Click on a star to rate it!
Average rating 0 / 5. Vote count: 0
No votes so far! Be the first to rate this post.
I’m Archana R. Chettiar, an experienced content creator with
an affinity for writing on personal finance and other financial content. I
love to write on equity investing, retirement, managing money, and more.
