
If you look at stock charts to decide when to buy or sell, you’ve probably heard about candlestick patterns. These patterns are like visual stories of price movements that can help traders and investors predict what may happen next. Among these patterns, the Doji candlestick Pattern is a key signal of market uncertainty.
But what exactly is a Doji? How can you use it while navigating the ups and downs of the stock market? Let’s dive into this concept and understand all about Doji Candlesticks.
What Is a Doji Candlestick?
The word “Doji” comes from Japanese, meaning “mistake” or “error,” because it’s unusual for a stock’s opening and closing prices to be nearly identical. A Doji candlestick is a unique pattern you’ll spot on stock charts. Picture a candle with an extremely thin or almost invisible body — that’s what a Doji looks like. It forms when a stock opens and closes at nearly the same price.
This shows that although the price may have decreased during the trading session, it eventually settled right back where it began. You can think of it like a tug-of-war between buyers and sellers that ends without a winner, signaling uncertainty in the market.
Types of Doji Candlesticks
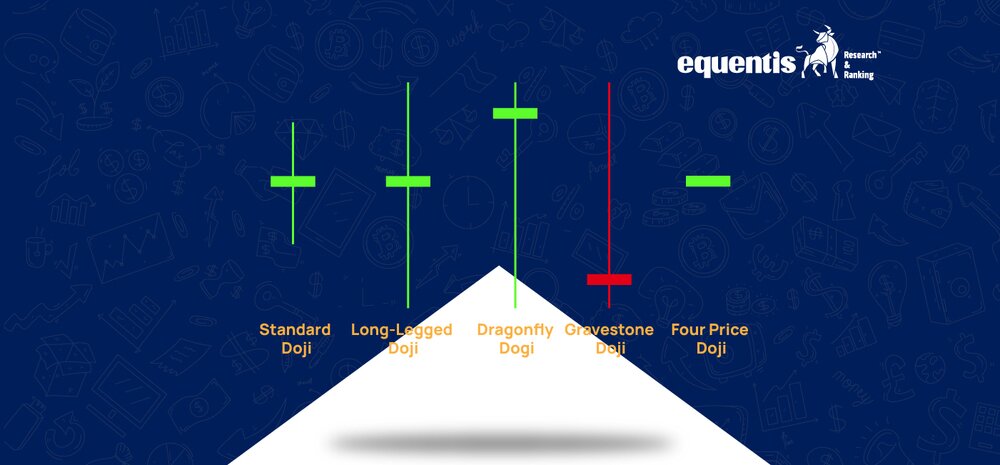
Not all Dojis are the same. Here are some common types you may notice on charts:
1. Normal Doji
A Standard Doji has visible upper and lower wicks with a tiny or non-existent body, meaning the opening and closing prices are nearly the same. This pattern reflects market indecision, where buyers and sellers are equally strong, causing the price to fluctuate but settle without a clear direction.

2. Long-legged Doji
A Long-legged Doji has much longer wicks on both sides, indicating significant price movement during the trading session. However, the price ultimately closes close to where it opened. This shows that although buyers and sellers were active and pulled the price in both directions, neither could dominate.

3. Dragonfly Doji
A Dragonfly Doji has a long lower wick and no upper wick. This shape shows that prices fell sharply during the session but recovered by the close, ending near the opening price. It usually signals a potential bullish reversal if it appears after a downtrend, as buyers push prices back up.

4. Gravestone Doji
A Gravestone Doji features a long upper wick and no lower wick, suggesting that prices rose high during the session but fell back to close near the opening price. This can indicate a potential bearish reversal if it forms after an uptrend, as sellers manage to overpower buyers.

What Does a Doji Candlestick Indicate?
The main message of a Doji candlestick is uncertainty. It signals that neither buyers nor sellers are in complete control. But depending on where it appears in a trend, it can mean different things:
1. Reversal Signal
A Doji appearing after an extended uptrend or downtrend could signal a potential reversal. For example, If the stock has been rising for days and a Doji forms, it may indicate that buyers are losing strength, and a fall could follow. If the stock has fallen, a Doji could mean sellers are tired, and a bounce might happen.
2. Continuation Signal
Sometimes, a Doji doesn’t mean a reversal but a pause before the trend continues. The market may be taking a “breather” before moving further in the same direction.
3. High Volatility or Low Momentum
Depending on the size of the wicks, a Doji could suggest either high volatility (big price swings) or low momentum (very little movement).
Why Should You Care About Doji Candlesticks?
Understanding Doji candlesticks can help you make smarter decisions when investing or trading. Here’s why:
1. Entry and Exit Points
A Doji near support or resistance levels could help you decide when to enter or exit a trade.
For instance, if you see a Doji at a resistance level (a price where stock often falls), it might be time to sell or avoid buying. It might be a buy signal if you see a Doji at a support level (a price where stock often bounces).
2. Risk Management
Since Dojis indicate uncertainty, they remind you to avoid risky trades or wait for confirmation before acting. You could combine them with other indicators like volume, RSI, or moving averages to make better choices.
3. Understanding Market Sentiment
Sometimes, people rely on tips from a share market advisor, but reading Doji patterns on your own gives you a sense of what the broader market is thinking.
Doji and NSE Trending Sectors
You might wonder, “How is a Doji useful when looking at “NSE trending sectors?” When a sector, like IT, Pharma, or Banking, is trending, spotting a Doji on the sector’s index chart could give you early hints about what might happen next.
For example, If the Bank Nifty index has been rising but forms a Doji, it may indicate that the upward momentum is slowing, and a correction could be around the corner. If a sector like Pharma has been under pressure but suddenly forms a Doji, there might be a chance for a bounce back. So, combining knowledge of Doji patterns and trending sectors can make your analysis sharper.
How to Use Doji Candlesticks in Trading?
Here are some practical tips for using Doji candlesticks in your trading:
1. Don’t Rely on Doji Alone
Remember, a Doji is not a strong buy or sell signal. Always combine it with other tools like support/resistance, trendlines, RSI, MACD, or volume analysis.
2. Wait for Confirmation
Once a Doji appears, wait for the next candle to confirm the trend. For example:
- After a Doji, if a bullish candle (green) forms, it may confirm a buy signal.
- After a Doji, if a bearish candle (red) forms, it may confirm a sell signal.
3. Set Proper Stop Loss
If you trade based on a Doji, always set a stop loss to manage risk. Markets can be unpredictable, and protecting your capital is crucial.
4. Follow a Share Market Advisor
If you are new and still learning, following a share market advisor may help you understand how to combine Doji analysis with broader strategies. But always make sure the advisor is trustworthy and registered.
Final Thoughts
In summary, a Doji candlestick acts like a warning sign — signaling that the market is undecided and you should be cautious. Whether analyzing individual stocks or watching chart formations like the cup and handle pattern and rounding bottom pattern, understanding the Doji candlestick can enhance your trading and investing decisions.
However, remember to never rush into trades based on a Doji alone. It’s essential to combine it with other technical indicators or patterns, and when in doubt, consult a professional share market advisor for guidance.
Related Posts


Disclaimer Note: The securities quoted, if any, are for illustration only and are not recommendatory. This article is for education purposes only and shall not be considered as a recommendation or investment advice by Equentis – Research & Ranking. We will not be liable for any losses that may occur. Investments in the securities market are subject to market risks. Read all the related documents carefully before investing. Registration granted by SEBI, membership of BASL & the certification from NISM in no way guarantee the performance of the intermediary or provide any assurance of returns to investors.
FAQs
What is a Doji candlestick?
A doji candlestick indicates market indecision. When opening and closing prices are nearly equal, it signals a potential trend reversal or continuation based on confirmation.
How does a Doji candlestick affect trading decisions?
A Doji warns traders of uncertainty. It suggests pausing to observe the next move, especially when combined with patterns like a cup and handle or rounding the bottom for confirmation.
Can a Doji candlestick predict market reversals?
Yes, a Doji can signal potential reversals if other indicators support it, but traders shouldn’t rely solely on it to make buy or sell decisions.
Where is a Doji most effective in charts?
A Doji is most effective near support or resistance levels or after strong trends, helping traders anticipate possible reversals when paired with other technical patterns.
Should beginners trade solely on Doji patterns?
No, beginners should avoid trading only on Doji patterns. Combining them with other tools like RSI, cup and handle pattern, or seeking expert advice is essential.
I’m Archana R. Chettiar, an experienced content creator with
an affinity for writing on personal finance and other financial content. I
love to write on equity investing, retirement, managing money, and more.