Investing in the stock market can be tricky, especially for beginners. However, understanding technical indicators like the Morning Star pattern can help make better investment decisions. Traders widely use this simple yet powerful pattern to predict potential trend reversals.
Investors looking for high return stocks often rely on such patterns to identify potential entry points. The Morning Star pattern signals a bullish reversal, making it a valuable tool in stock market advisory strategies. By combining this indicator with other technical and fundamental analyses, traders can enhance their decision-making process and improve their chances of making profitable investments.
This article will explain the Morning Star candlestick pattern, how it forms, and how to
use it to invest smartly.
What is the Morning Star Pattern?
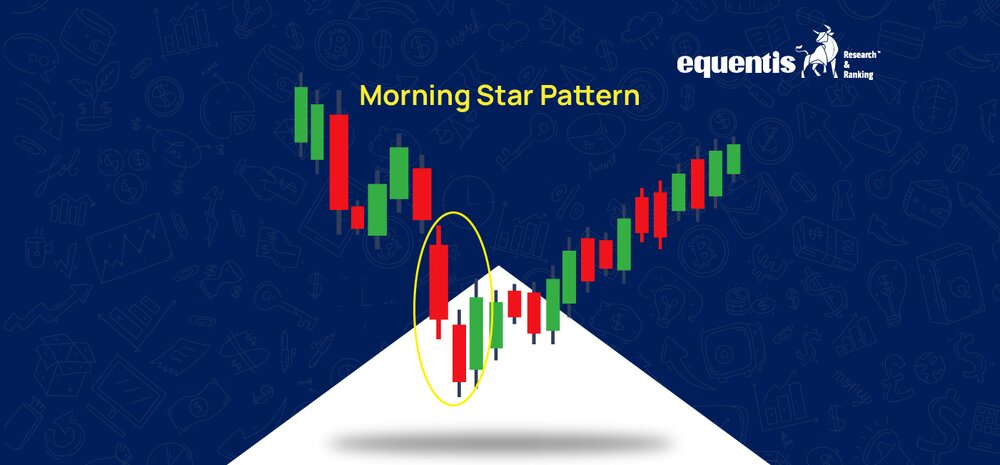
The Morning Star is a bullish reversal candlestick pattern that appears after a downtrend. It signals that the market is shifting from a bearish (downward) trend to a bullish (upward) trend. The pattern consists of three candlesticks and suggests that selling pressure is weakening, allowing buyers to take control.
Think of it as the light after a long dark night – the market, which was falling, is now showing signs of recovery.
Formation of the Morning Star Pattern
The Morning Star pattern consists of three candles:
- First Candle (Bearish Candle)
- This long red (or black) candle indicates intense selling pressure.
- The price closes lower than it opened, continuing the downtrend.
- Second Candle (Small or Doji Candle)
- This smaller candle can be red, green, or even a doji (a candle with very little body).
- It represents market indecision – neither buyers nor sellers are in full control.
- Third Candle (Bullish Candle)
- This is a long green (or white) candle that closes above the midpoint of the first candle.
- It confirms that buyers have taken over, indicating a possible trend reversal.
For this pattern to be reliable, the third candle should close strongly bullish, showing a clear trend reversal. It should recover most of the losses from the first bearish candle, indicating strong buying pressure. A higher closing price confirms the shift from a downtrend to an uptrend.
Know More: SEBI Registered investment advisory | Stock investment advisory
What Does the Morning Star Pattern Indicate?
The Morning Star candlestick pattern signals a possible market reversal. It typically appears after a downtrend, suggesting that selling pressure is weakening and buyers are gaining control.
In a bearish trend, the first candle continues the downward movement, followed by a second candle that shows hesitation in the market. The third candle confirms the reversal with a strong, bullish move. This pattern helps traders anticipate a potential upward trend.
How to Identify the Morning Star Pattern?
To spot a Morning Star pattern on a stock chart, look for the following characteristics:
- It must appear after a downtrend.
- The first candle should be long and bearish.
- The second candle should be small, showing market hesitation.
- The third candle must be strong and bullish, closing above the midpoint of the first candle.
- Trading volume should ideally increase on the third day, confirming the bullish reversal.
How to Invest Using the Morning Star Pattern?
Once you identify a Morning Star pattern, here’s how you can use it to make an informed investment decision:
Confirm the Pattern
Do not invest immediately after spotting the pattern. Instead, wait for confirmation. Check whether the third candle closes above the midpoint of the first candle and whether the next candle also opens strongly.
Source: learnstockmarket.in
Check Trading Volume
A Morning Star pattern is more reliable if the trading volume increases on the third candle. High volume indicates that more traders believe in the reversal.
Use Additional Indicators
To reduce risks, use technical indicators like:
- Moving Averages: A crossover of short-term moving averages above long-term moving averages can confirm the trend reversal.
- RSI (Relative Strength Index): An RSI moving above 30 from oversold territory supports the pattern’s validity.
- Support and Resistance Levels: If the Morning Star appears near a strong support level, it adds to its reliability.
Set a Stop-Loss
Always set a stop-loss to manage risk. A good strategy is to place the stop-loss below the low of the second candle. This way, if the pattern fails, you limit your losses.
Plan Your Exit Strategy
While entering a trade is important, knowing when to exit is equally crucial. You can set a target based on previous resistance levels or trailing stop-loss to lock in profits as the price rises.
Example of a Morning Star Pattern in Action
Let’s say a stock is in a downtrend, and the following happens:
- Day 1: A long red candle forms as the stock closes lower.
- Day 2: A small-bodied candle appears, indicating indecision.
- Day 3: A long green candle forms, closing above the midpoint of the first day’s candle.
- Volume increases on the third day, confirming buying pressure.
At this point, a trader can consider entering a long position (buying the stock) after further confirmation.
Advantages of Using the Morning Star Pattern
- Easy to Identify: Spotting this pattern on a chart becomes simple once you understand the structure.
- Effective in Predicting Reversals: It signals trend changes early, allowing traders to enter early.
- Works in Different Markets: This pattern can be used in stocks, forex, commodities, and cryptocurrencies.
Limitations of the Morning Star Pattern
- Not Always Accurate: Like all technical patterns, the Morning Star is not foolproof and should be used along with other indicators.
- Needs Confirmation: Acting on the pattern alone without confirming signals can lead to losses.
- Market Conditions Matter: The pattern may not work well in choppy or sideways markets.
Final Thoughts
The Morning Star pattern is useful for traders looking to spot potential bullish reversals. Investors can make better-informed trading decisions by understanding its formation, confirming signals, and using additional technical indicators.
Additionally, consider using the cup and handle pattern and the rounding bottom pattern alongside the Morning Star to confirm bullish signals. These patterns help identify strong continuation trends, improving the accuracy of your trades.
However, always remember that no pattern guarantees success. Combine technical analysis with fundamental research, manage risks with stop-losses, and avoid emotional trading.
Disclaimer Note: The securities quoted, if any, are for illustration only and are not recommendatory. This article is for education purposes only and shall not be considered as a recommendation or investment advice by Equentis – Research & Ranking. We will not be liable for any losses that may occur. Investments in the securities market are subject to market risks. Read all the related documents carefully before investing. Registration granted by SEBI, membership of BASL & certification from NISM in no way guarantee the performance of the intermediary or provide any assurance of returns to investors.
FAQs
What is a Morning Star pattern?
The Morning Star is a bullish candlestick pattern indicating a potential trend reversal. It forms at the bottom of a downtrend, comprising three candles: a large bearish candle, a small-bodied candle (doji or spinning top), and a large bullish candle. It signals weakening bearish momentum and a potential bullish revival.
What does the small-bodied candle signify?
The small-bodied candle, often a doji or spinning top, represents indecision in the market. It shows that the previous downtrend is losing momentum, and neither buyers nor sellers completely control it, creating a potential turning point.
How can investors use the Morning Star pattern?
Investors can use the Morning Star pattern to identify potential buying opportunities. After confirming the pattern, they can enter a long position, placing a stop-loss order below the low of the pattern to manage risk. It’s best used with other technical indicators for confirmation.
What are the limitations of the Morning Star pattern?
Like all technical patterns, the Morning Star is not foolproof. It can produce false signals, especially in volatile markets. Confirmation with other indicators is essential. Volume and broader market trends should be considered to avoid relying solely on this pattern for investment decisions.
How useful was this post?
Click on a star to rate it!
Average rating 0 / 5. Vote count: 0
No votes so far! Be the first to rate this post.
I’m Archana R. Chettiar, an experienced content creator with
an affinity for writing on personal finance and other financial content. I
love to write on equity investing, retirement, managing money, and more.
- Archana Chettiar


